Showing posts with label fundedByAustralianNationalDataService. Show all posts

Friday, 27 September 2013

Summary


We have involved representative users from targeted user communities through the whole development process. The users have been testing  the user-facing functionality of the Soils2Satellites product in an iterative format, with their input driving the ongoing development of the application. Mostly the user interface worked to meet user requirements, and the project team has been pleased to see the system being supported by potential users.

Our test users


User 1 is a postgraduate at University of Adelaide who specializes in ecological theory and genetic and genomic approaches to answering biological questions. They have worked in weed management and the impact of climate change on invasion patterns. We expected this user to represent researchers interested in species invasion and change in the face of climate change.

User 2 is the Science and Technology Lead for a TERN MSPN facility and has had a range of Scientific and Management roles in both the Northern Territory and the South Australian Government. We expected this user to represent a senior science focused researcher and University administrator exploring the information in S2S.

User 3 is an internationally respected environmental scientist who has spent many years working in the field of conservation ecology in Australia and the USA. Their primary research focus has been identifying ecological traits of species that are vulnerable to extinction. They have also worked for several state and federal government agencies. We expected this user to represent senior academics and researchers and policy making site users.

User 4 is a field ecologist and researcher. We expected this user to represent ecological data collectors and providers who could supply information.

Functional Testing


Prior to our user group becoming involved in testing a particular component of the application the project team conducted significant functional testing, to ensure that as many bugs as possible were squashed, leaving users to focus on the UX and the application’s functionality and workflow.

Use Cases


Both functional and User testing were performed with reference to the Use Cases listed below. User testing was performed in a far more “free form” manner than the Functional testing with less prescription upon specific activities and in a less structured environment.
  • Find Study Location
  • Find Study Location Visit
  • View Study Location Summary
  • View Study Location Visit Summary
  • View Sampling Unit Summary
  • Extract Study Location/Study Location Visit Data
  • Compare Study Locations
  • Compare Study Location Visit
Users also tested areas of the system, in particular with reference to the Mapping Interface without any real reference to Use Cases.

Find Study Location & Find Study Location Visit

This functionality allows a user to find one or more study location(s) matching the search criteria, they have entered. The Search criteria being either or both of
  • a spatial locational area defined by drawing a bounding box on a map or
  •  textual search criteria entered via a text box or selected from a pre-defined list
using this functionality returns and displays a list of matching study locations and visits that can be added to the study locations/visits list for further review.   

What succeeded:
The technique of searching for locations via a map interface and then filtering a set of returned values with further parameters is very familiar to most similar web applications and the users found this functionality intuitive and easy to use.

What we learned:
User feedback defined the amount of summary detail that was to be displayed for each returned study location and visit found by the search, they also particularly asked for a link to be included that provides swift access to the Study Location Summary details for a particular site.

View Study Location & Study Location Visits Summary

This functionality allows a user to view a set of summary data for either an individual study location or a study location visit. The user accesses the summaries via the same method of either clicking a specific link to the summary page from the list of Study Locations and Visits returned from a Search, or by accessing (via a link) the visit summary page from within the study location summary or vice versa

What succeeded:
Users easily understood the functionality, i.e. they were able to navigate to the summary pages they wished to see. Users were also happy with the level of detail in the summary pages after they had provided input. The Users saw the benefits of the data visualisations in quickly and simply representing the underlying data.

The users also contributed to the particular data visualisations in each summary page in terms of the business logic/rules for each graph/chart and also the design and layout of the page real estate.

What we learned:
Initially there were a number of data items missing from both summary data sets that we subsequently added to the data displayed when asked to by the users. The formatting and order of the data displayed was also updated based upon feedback.

We amended the navigation of the application too to make visits and study locations available in a more direct fashion by removing some of the hierarchical navigation that had initially been implemented. 


View Sampling Unit Summary

This functionality allows a user to view a particular sampling unit summary for a particular Study Location Visit. There are a number of different Sampling Unit types in Soils2Satellites
  • Basal Wedge
  • Point Intercept
  • Structural Summary
  • Soil Observation
  • Soil Bulk Density
  • Soil Character
Each of these Sampling Units types has a specific set of data and a set of data visualisations, the Sampling Unit Summary page is accessed via a link form either a Study Location or Study Location Visit Summary page.

What succeeded:
As with the other summary pages users easily understood the functionality, i.e. they were able to navigate to the summary pages they wished to see and understood the data they were being presented within each different Sampling Unit Summary page.

Users were also happy with the level of detail in the summary pages after they had provided input. The users saw the benefits of the data visualisations in quickly and simply representing the underlying data.
The users also contributed to the particular data visualisations in each summary page in terms of the business logic/rules for each graph/chart and also the design and layout of the page real estate.

What we learned:
Initially there were a number of data items missing from both summary data sets that we subsequently added to the data displayed when asked to by the users. The formatting and order of the data displayed was also updated based upon feedback.

The algorithms used for the Point Intercept Sampling Unit Summary in particular were significantly influenced by the user feedback as were the colours used in the visualisations that represent the transect layout – the colours were changed to the actual colours of substrates recorded in the field. The size of the points representing the individual Growth forms recorded in the transact are also due to direct input from the users.

The particular visualisation showing comparison between Auscover Fractional Cover layer data and equivalent “Ground Truthing” data from AusPlots/TREND  is also a result of direct input from users. 

Extract Study Location/Study Location Visit Data

A key requirement for Soils2Satellites was for the users to be able to simply create and extract a set of data derived from the whole S2S database. Data can be extracted at the Sampling Unit Summary level or for one or more Study Location Visits. At the visit level standard data about that visit is included plus data to be extracted can be further filtered to include one or more or all of the data for the Sampling Units performed during that visit. 

What succeeded:
The simple extract format of a single file in .csv format downloaded as a zip file was appreciated by the Users, as was the creation of a DOI to support re-use of the data. This functionality successfully re-used technologies from the ALA and the TERN HQ DOI creation functionality. 

What we learned:
The initial navigation process to access the extract functionality was altered based upon the user feedback. An Export button was added to the Search Results screen to allow users to quickly Search, Access and download data without having to access each individual Sampling Unit Summary page. 

The data made available from intersecting the environmental layers data with the location of a particular Study Location was added to the extract data due to User feedback.

Compare Study Locations

This functionality allows a user to view and compare a range of data values in their raw form and through visualisations for any number of Study Locations returned from the Searching functionality.

What succeeded:
The ability to be able to compare a standard set of data across sites in varying geographical locations in one screen and via a range of visualisations was seen by the users as a key function of the application.

What we learned:
The users contributed to the particular data visualisations in this page in terms of the business logic/rules for each graph/chart and also the design and layout of the page real estate. The identification of the types of data that would “work well together” as visualisations, that provide a meaningful “view” of a site were implemented and refined from this user input. 

General Mapping/Spatial Feedback


The S2S application contains a fairly standard Mapping interface using OpenLayers and the Google Maps API, this functionality was leveraged from the capability provided within the Atlas Of Living Australia’s spatial portal. This provides standard map navigation tools along with the ability to select points visible in the map and add them to a selection list.

At the request of the users the opacity of the map’s layers can be altered plus the layer attribute details can be viewed. The mapping functionality also allows users to build sets of environmental layers (derived from the full list of environmental layers provided by the ALA) that they can store and re-use as personal sets of contextual layers during their searches. 

Individual User Experiences


User 1

User 1 was predominantly involved in identifying the types of visualisations that would be most valuable to non-ecologically focused users through making the data in S2S discoverable and in defining how it would be best to display interesting and significant relationships across the different data types. This users input was key to defining the data outputs in the application.

“The intuitive navigation allows me to easily visualise trends in the data that would otherwise be extremely difficult and time consuming to consider, furthermore, results are presented in such a way that novel associations can present themselves – helping to stimulate new ways to think about ecological associations and identification of genuine and interesting knowledge gaps where new research can be focussed."

User 2

User 2 was key in providing the scientific understanding and business rules behind a number of the visualisations in the application in particular in the Point Intercept Sampling Unit Summary visualisations. This user was particularly pleased to see that the data generated by Auscover from its remote sensing activities can be ground truthed by data collected under AusPlots/TREND and the correlations or differences in the data be easily and clearly visualised. They are especially keen to be able to now take the application further in this area if possible.

User 3

This user was predominantly involved in detailing what raw data for each Study Location and Visit would be relevant for display and download and how this data was to be grouped together in the application.  As with the other users this user was also involved in providing feedback to the project team around the data visualisations.

User 4

User 4 commented on how following the implementation of the data visualisations in the application, it was now possible to demonstrate to the landowners and managers of the country where the data collection activity had taken place the value and usefulness of this type of data collection. This then encourages further access to areas for future re-visits and also for access to other areas where monitoring surveys may not have taken place before.

“The Soils toSatellites tool is important in fostering the continuing relationship between the scientific community and those who grant us access to their land. By allowing land managers to visualise the data shortly after we’ve collected it and see how it fits in to a bigger picture, it’s easy for us to show the value of the work. It can also help landowners to manage their lands, whether to maximise agricultural productivity, ensure strong conservation outcomes, or a mix of both.”

Tuesday, 3 September 2013

Final Post

1.   Introductory Product Information


Soils-to-Satellites (S2S)

The tool brings disparate and diverse datasets together into an easy-to-use interface that enables visualisation and comparison. These datasets include ecological and genomics data collected through TERN’s Multi-Scale Plot Network and delivered through Eco-informatics’ Australian Ecological Knowledge and Observation System (ÆKOS), remote sensing datasets available through AusCover, alongside the spatial and biodiversity information available via the ALA.

S2S now enables researchers to explore and display the relationships between these diverse data sets in ways not previously experienced in a single application. For example, users of the tool can display layers of Australian environmental data such as elevation, temperature or soil type, and then ‘drill down’ to view and explore rich ecological and genomics data across those layers.

2.   Instructional Product Information


"Through AusPlots and the Australian Transect Network, we've now surveyed around 300 plots, which represents a wealth of ecological data that we hope will support scientists and managers across Australia. Our data is undeniably valuable, and represents thousands of man hours in some very inaccessible environments. But trying to show potential users the scope of the data we've collected and how it can be combined for useful analysis can be a real challenge. The ability of Soils to Satellites to display and combine the data we've collected in real time, from biomolecular sequences to landforms, allows users to do just that, and make sure that our data is used by others, to the maximum benefit of scientists and the community."
          Stefan Caddy-Retalic
               Terrestrial Ecosystem Research Network (TERN)

"Soils to satellites allows to me explore large and complex data sets in a meaningful and dynamic way. As we move towards greater levels of data sharing and maximisation of initial investment in data collection, projects like Soils to Satellites become increasingly important tools that allow us to navigate the wealth of existing data, assess its usefulness and fitness for repurposing, and ultimately access the raw data and all the associated contextual information. Without efficient and intuitive ways to explore the relationships between existing data sets at a range of scales, such as those provided through Soils to Satellites, we will not be able to take full advantage of the considerable scientific knowledge base we have at our finger tips. The intuitive navigation allows me to easily visualise trends in the data that would otherwise be extremely difficult and time consuming to consider, furthermore, results are presented in such a way that novel associations can present themselves – helping to stimulate new ways to think about ecological associations and identification of genuine and interesting knowledge gaps where new research can be focussed."
          Eleanor Dormontt
               Terrestrial Ecosystem Research Network (TERN)

"Working in projects which collect lots of data, it’s easy to lose sight of where and how the data will be used. As someone who is generating this data in the field, Soils to Satellites represents a major step forward in making sure that the data I collect will be used by others. By providing different ways of visualising complex data, scientists and land managers can understand the relationships between that data in a simple way. This means that data that might otherwise gather dust in an obscure database is available in a simple format for everyone to access. For example, previously labour-intensive comparisons – say between vegetation community structure and soil characteristics (like pH and salt content) are easy, either at a local or continental scale.

The Soils to Satellites tool is also important in fostering the continuing relationship between the scientific community and those who grant us access to their land. By allowing land managers to visualise the data shortly after we’ve collected it and see how it fits in to a bigger picture, it’s easy for us to show the value of the work. It can also help landowners to manage their lands, whether to maximise agricultural productivity, ensure strong conservation outcomes, or a mix of both.

Soils to Satellites will only increase in usefulness as a tool as more data becomes available. Information on soil metagenomics, population genetics and leaf area index will build on the current platform to make soils to satellites an indispensable tool for ecologists and land managers alike."
           Emrys Leitch
               Terrestrial Ecosystem Research Network (TERN)

2.2 Links to the actual product

2.3 Source code

2.4 User Guide

3.   Product (or Product Components) Re-usability Information


The Soils to Satellite application provides a service to researchers, that further represents the potential of integrating major research infrastructure.  Data available from TERN Eco-informatics' ÆKOS data portal (raw ecological data) and the Atlas of Living Australia (biodiversity data and spatial products) can be searched, displayed and visualised thanks to an alliance of data custodians who publish their data and products.

Any data downloaded from SoilsToSatellites can then be re-used outside of the system by ecologically focused researchers

4.   Contextual Product Information


4.1 Licensing of final product
  1. SoilsToSatellites is available under Mozilla Public Licence v1.1
  2. The data downloadable from the application is licenced through

Creative Common By Attribution (CC-BY) Copyright Licence v3.0. This licence lets others distribute, remix and build upon a work, even commercially, as long as they credit the original creator/s (and any other nominated parties)

4.2 Sustainability
  1. All the software and data components will be located on NeCTAR infrastructure, initially within the University of Melbourne and then with eResearchSA at the Adelaide node of NeCTAR.
  2. The SoilsToSatellites portal will be maintained in the public domain for 12 months by TERN Eco-informatics and ALA, with support from NeCTAR.
  3. New data will be added to SoilsToSatellites by TERN Eco-informatics staff.


Tuesday, 15 January 2013

Post 6. PROJECT OUTPUTS & OUR PRIMARY PRODUCT

The Soils to Satellites Project delivers a web-based application that allows users to combine and explore data from the Atlas of Living Australia (ALA) and the Terrestrial Ecological Research Network (TERN) ÆKOS application. These data are associated with a range of survey work conducted by TREND and TERN AusPlots and also the ALA’s environmental and species distribution spatial layers. These data are aggregated in the application by reusing and re-implementing the functionality already present in the ALA. - please refer to other posts for details on these data.

This site will allow users to search for data in a number of ways either through “pre-canned” views of data or by building structured queries. Data can be viewed at a summary, aggregated level or at an individual field record level.   Result sets can be visualised through a set of  tools provided by the ALA whilst the results can also be exported in csv format.

Result sets will also be provided as RIF-CS collections to ANDS for further easy discoverability. The code used to create these websites will be available for reuse under a GNU General Public License. All components created by the project team will be available from this Bitbucket site along with documentation (Use Cases, Architecture diagrams etc. A user reference manual will address operational day to day usage procedures and will explain how to go about using application.) on Google Drive. The application will be hosted through a NeCTAR node at e-Research South Australia (eRSA) at the University of Adelaide


The product itself will be presented or publicised in a number of ways:
  • Press release(s) targeted at the Ecological and Conservation communities and DSIIRTE, that publicise the outcomes and collaborative achievements relating to the project and the associated software tool developed with ANDS funding. As well as highlighting the new research now possible by Prof Andy Lowe’s research group by bringing the Soils to Satellite data sets together in a single application.
  • Demonstration of the resulting solution at the TERN Annual Symposium, February 2013 by Prof Andy Lowe. Attendees include TERN staff, university researchers, Government decision-makers and policy experts, representatives from peak bodies, and industry sector staff. The value message will focus on potential research that can be conducted with the assistance of the tool that couldn't be done before.
  • Releases posted through social media channels such as Twitter, LinkedIn, Pintrest and Facebook.

Additionally, the following Demonstrations of Value may be pursued:

  • Demonstration of the value of the combinatorial solution for use in policy and natural resource management contexts, e.g. utilising the spatial power of the systematically collected genomics data over environmental gradients to show:
    • i) future management implications of temperature change, rainfall, drying for critical issues such as species genetic flow, refugia and evolutionary/extinction potential; &
    • ii) the value of integrating existing expertise from ALA and TERN for cross-cutting solutions.

In his roles as TERN Associate Science Director and Head Science advisor for the SA Department of Water, Environment and Natural Resources (DEWNR), Prof Andy Lowe can assemble key agency decision makers in both funding and policy contexts. Given the timing of governmental budgetary allocations, late 2012/early 2013 would appear to be the most suitable timing.
  • Endorsements from key direct and indirect stakeholders such as Commonwealth agencies
  • One or more academic papers submitted by the Science Stakeholders (Lowe, Cross, Guerin) by the 2nd quarter (calendar year), 2013 - in recognised journals which reference the integration and analysis enabled by project

Monday, 5 November 2012

Post 5. KEY TECHNOLOGIES & KEY FEATURES

High level Architecture diagram
High level architecture diagram showing interactions between components.
The crux of this project is the integration of data from AEKOS and the Atlas of Living Australia (ALA).

The Soils to Satellite portal is the integration point. This portal is written using the Grails platform version 2.1 and makes use of:

  • OpenLayers version 2.12  javascript mapping library
  • JQuery version 1.7 javascript library
  • Bootstrap version 2.2.1 front end development framework
This portal relies on web services from AEKOS and ALA. These services are predominantly JSON services and are stateless. Environmental layers are served from ALA using WMS via Geoserver.

The development of the portal is being achieved using the Intellij IDE.

One of the most important parts of the technology being used are the stateless of the web services and the fact we are favouring JSON as core output. This should hopefully promote re-use by external tools in addition to making consumption of the data from AEKOS and ALA straightforward for the Soils to Satellite portal. The choice of Grails as the core platform for the Soils to Satellite portal has the following benefits:

  • Grails runs on the industry proven Java Virtual Machine platform
  • It supports rapid application development
  • Has a convention over configuration style
  • Gives an out of the box recongisable structure to software projects with clear separation of Model, View and Controller.

Development of a user-friendly interface which handles the complexity of ecological data. Presenting this data in a way that is navigable and simple for users to follow will also lead to user satisfaction.

Friday, 2 November 2012

Post 4. "KEY FACTORS CUSTOMERS WILL USE TO JUDGE THE VALUE OF OUR PRODUCT", i.e. how do you independently measure success?

The Soils to Satellites Project has a number of engaged stakeholders (customers), in particular through the TREND SA project and the Australian Centre for Evolutionary Biology and Biodiversity, who are actively conducting research into ecological questions around the topics of;


  • Predicting the impact of climate change on species distribution (Conservation)
  • Identifying Biodiversity Hotspots (Conservation / Agriculture)
  • Understanding Soil and Vegetation Communities (Agriculture)
  • Understanding the Conditions of Ecosystems (Conservation)


It is understood that for these researchers to embrace the S2S tool as a significant addition to their research activities, it will need to become an integral part of their workflows and processes.

It is expected that S2S will improve researcher’s access to the extremely broad range of ecological data that is available from the ALA, TREND SA and TERN AEKOS, by allowing users to quickly and easily visualise relationships between disparate data in S2S.

To do this, S2S provides functionality that allows for the exploration and display of previously undiscovered relationships between disconnected and previously unrelated data sets, through sophisticated spatial and data presentation tools developed in the ALA spatial portal and via the AEKOS Indexing and Search services, which are being re-used in S2S. The system then allows the user downloading this data for further offline analysis and examination in tools such as MATLAB and ‘R’. 

It is anticipated that re-use of these data discovered through S2S will contribute to continental scale ecological research and facilitate collaboration between various groups, which in turn can support science based policy and NRM decision making across State and Commonwealth governments. 

The project itself has adopted an Agile development approach, whereby development and delivery of the S2S product is undertaken in a number of cycles, known as ‘sprints’. At the end of each sprint, new functionality developed in S2S are demonstrated to stakeholders and feedback sought to be considered for inclusion in the S2S ‘Product Backlog’ and subsequent future iterations of work. This approach enables issues and additional requirements to be incorporated right throughout the development phase of the project rather than at the end, which typically has severe negative impacts on the three core measures of project success - time, quality and costs. 

In order to independently measure the success of the project and the S2S product, we will design and conduct a customer survey at the end of the project.  This survey will be constructed around the following questions which will enable the project team - ALA, TERN AEKOS and ANDS to judge the value of the product:


  • Can I easily find the data I need for my research?
  • Do the data visualization tools developed make the data discoverable?
  • Can I reuse these data in offline tools once they have been found in S2S?
  • Are the environmental layers useful for my research?
  • When reviewed against other data discovery portals, is the product generally of high quality in terms of usability and performance?
  • How does Soils to Satellites compare to other similar tools you have used in the past?
  • On a scale of 1-5 can you estimate the overall value that the system provides in supporting your research activities?
  • Please identify the areas of the system functionality that provides you the most value.
  • Has the system been of value in addressing the following research topics: 
    • Climate change prediction of species distribution (Conservation)
    • Identifying Biodiversity Hotspots (Conservation / Agriculture)
    • Understanding Soil and Vegetation Communities (Agriculture)
    • Understanding the Conditions of Ecosystems (Conservation)


Ideally, this survey will merely be a formality, as the project is structured in such a way that stakeholders are continuously ask questions about what improvements are required with the actual S2S product in front of them.

Friday, 19 October 2012

Post 3. HOW THE PRODUCT WILL MEET OUR USERS NEEDS

TARGET CUSTOMERS


The target customers/users of the application are predominantly researchers who are working to answer questions that relate to the topics of;
  • Climate change prediction of species distribution (Conservation)
  • Identifying Biodiversity Hotspots (Conservation / Agriculture)
  • Understanding Soil and Vegetation Communities (Agriculture)
  • Understanding the Conditions of Ecosystems (Conservation)

Other users of the application will include decision and policy makers from groups and organisations involved in Natural Research Management (NRM), such as State and Local Government Authorities (LGAs).
Soils2Satellites will support the investigation into the future management implications of temperature change, rainfall and drying for critical issues such as species genetic flow, refugia and evolutionary/extinction potential.

HOW THE PRODUCT WILL MEET OUR USERS NEEDS


The project will meet users needs through providing a publicly accessible web portal that provides users with the ability to select ALA-based species occurrence data and environmental layers, Auscover Satellite imagery and TREND plots data for exploration, display, comparison, link-to and/or download. 
The tool will support the exploration and visualisation of available relationships within the TREND and ALA data, including those relating to: species occurrence and environment; genetic diversity; spatial distribution and genetic variation at genes under selection and environmental variation; changes in environment in the past inferred from the distribution of genetic variation (e.g. refugia or genetic expansions).
The tools in the application will allow for data relationships to be explored in new ways, thus opening up ways to interpret existing information and/or exposing relationships between data that were not previously possible.
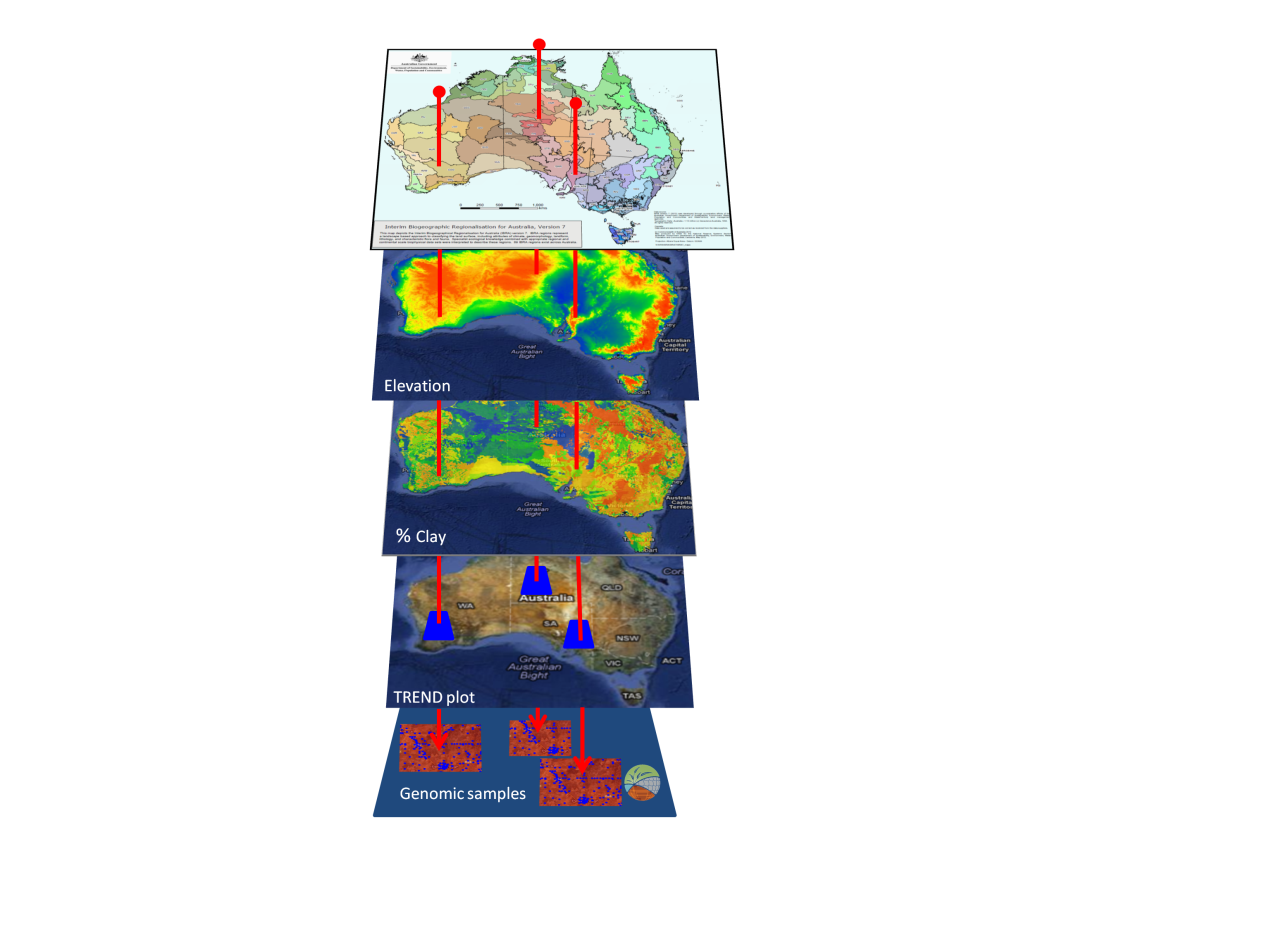
The Soils-to-Satellites tool will enable researchers to explore and display relationships between disconnected data sets in ways not previously experienced. For example, they will be able to display ’layers’ of Australian environmental data such as elevation, temperature or soil type, and then ‘ drill down’ to s to compare vegetation and genomics data across those layers (Diagram). Datasets identified through the tool will be provided to the ANDS ARDC at a collection level for further discovery by the research community.


Diagram 1. A stylised diagram showing how information for three plots within a TREND transect (dark blue) can be displayed and analysed in detail by overlaying the spatial information of four layers at exactly the same location in each layer to view the genomic data collected at the ‘plot’ level and stored in the  ÆKOS  data portal (Source of IBRA, elevation and % clay - Atlas of Living Australia, TREND plot layer derived with Google Earth, genomic samples are illustrations only ). Soils-to-Satellites enables researchers to visualise sophisticated ecological and genomics data through an integrated application for the first time.

The application will also deliver RIF-CS service and data collections to ANDS to support further discoverability of the data.

Thursday, 18 October 2012

Post 2. PRODUCT TEAM

Soils to Satellites is a collaboration between the Atlas of Living Australia and the TERN Eco-Informatics team from the University of Adelaide.  The collaboration would not have been possible without the support and funding from ANDS. 


The team from the Atlas of Living Australia


Peter Doherty - Project Manager

Peter has been the Program Manager for the Atlas since 2009 and, after having started out as a programmer before moving on to infrastructure systems, has an extensive career in the delivery and management of IT projects.

Dave Martin - Software Architect

Dave has been working in biodiversity informatics for 6 years, and prior to this has worked on healthcare and banking systems. He started working for the Atlas in 2008. Prior to this, he worked for the Global Biodiversity Information Facility (GBIF) in Copenhagen. He has skills in GIS, databases (relational, nosql), Lucene, Java, Scala, Groovy/Grails.

Dave Baird - Software Developer

Dave is an experienced analyst/programmer and has been a software engineer for 18 years.  Dave has been able to quickly pull together a demonstration environment using services from NECTAR and is using web services from the Atlas and as supplied by the TERN team to create the base S2S portal.  Dave was a key developer in the Biolink project and has strengths in:
  • Java/Scala 
  • RDBMS - MySQL, Postgres, Oracle, Ingres and SQLServer 
  • no SQL - Cassandra

Natasha Carter - Software Developer

Natasha has been working as a software engineer for 8 years.  She works for a small company that specialises in providing data integration solutions. She is experienced in the design and implementation of solutions using a variety of tools and technologies including:
  • Java/Scala 
  • RDBMS - MySQL, Postgres, Oracle, Ingres and SQLServer 
  • no SQL - Cassandra 
Natasha has been involved in the ALA since December 2009 contributing to the data and service layers.


Nick dos Remedios - Software Developer

Nick has been with the Atlas of Living Australia since 2008 and has been working as a software developer since 1999. Prior to that he worked as immunologist/molecular biologist/bioinformatician. He has experience in the areas of airline logistics, patent informatics and biodiversity informatics. He often gets pigeon-holed as front-end developer and spends most of his time coding in Java, Groovy, Javascript and HTML/CSS. Favourite frameworks/APIs include Grails, Spring MVC and jQuery.


Miles Nicholls - Data Manager

With a background as a business analyst in data warehousing and business intelligence Miles has been working with the Atlas since late 2009 as Data Manager.  Miles has  qualifications in science (although never used in anger and frighteningly out of date) and information systems and thinks it's great that the ALA combines the two.  Miles' work with the ALA involves discussing data sharing, open access licensing, data schemas and formats with the owners of data and transforming data using whatever tool will do the best job at the time.


The team from TERN Eco-Informatics


Martin Pullan - Project Manager

Martin has been working in IT for over 15 years and has been the IT Project Manager with TERN Eco-informatics for 18 months with responsibility for the AEKOS, SHaRED and S2S projects. Prior to this role he worked as an IT Project Manager in the South Australian government developing software applications that supported environmental monitoring and NRM activities.
    

Casper Yeow - Business Analyst

Casper has had over 13 years consulting in the Information Management industry, with experience in numerous business domains, primarily as a Business Analyst. He specialises in the areas of requirements gathering and analysis, business rules elicitation and process improvement.


Ben Till - Senior Software Developer

Ben is an enterprise software developer with 12 years experience. He has worked on projects all around Australia in domains including geospatial, emergency services, finance, real estate, correctional services and mobile applications. Ben has specialised skills in complex data processing.


Gilli Atkinson

Gilli is a Java Architect and software developer with over a decade of experience working in a range of government and private enterprise environments. He has worked on complex projects across Australia as a contract developer.

Post 1. PROJECT DESCRIPTION

A major component in ecological research is the discovery, visualisation and interpretation of the relationships between complex biological systems and their distribution in space and environment.

This project will explore the potential for visualising and analysing ecological and related data  from multiple plots and/or locations provided by the TREND SA project and spatial data from the ALA  - leading to the ability to make comparisons between these data.

“This one-year project unifies and combines spatial, multi-spectral remote sensing, ecological and genomics data in a single tool to meet the interdisciplinary data needs of scientists studying and managing Australian terrestrial ecosystems. Soils-to-Satellites will enable data users to analyse and display different types of research data more effectively,” says Craig Walker, Director of the Eco-informatics Facility of the Terrestrial Ecosystem Research Network (TERN) at The University of Adelaide.


For the first time, the project combines exemplar vegetation and genomics data produced by the TREND component of TERN’s Multi-Scale Plot Network (MSPN) facility with  the rich spatial and biodiversity information from the Atlas of Living Australia (ALA).  These TREND data will be supported by and provided from the TERN Eco-informatics ÆKOS data repository.


The Soils to Satellites tool will re-use and extend the existing infrastructure and functionality provided by the ALA’s open infrastructure and TERN Eco-informatics AEKOS platform.


Peter Doherty, Programme Manager of the Atlas of Living Australia, says “Thanks to support from ANDS and DIISRTE, this project is a great example of adding value to Australia’s investment in e-research assets.  We are pleased to be collaborating with the leading national research capabilities of the National Collaborative Research Infrastructure Strategy (NCRIS) for terrestrial ecosystems to build the Soils-to-Satellites tool.  Both teams are looking forward to combining our collective data infrastructure expertise and make ecosystem science even more productive and effective.”


This project is supported by the Australian National Data Service and the Atlas of Living Australia. Both capabilities are supported by the Australian Government through the National Collaborative Research Infrastructure Strategy Program and the Education Investment Fund (EIF) Super Science Initiative.